The indicator is drawn directly on the price chart as a horizontal histogram. The height of each bar corresponds to the volume of transactions concluded at a given price. At each level, there is a red bar for the volume at the BID price, and a green bar for the volume at the ASK price.
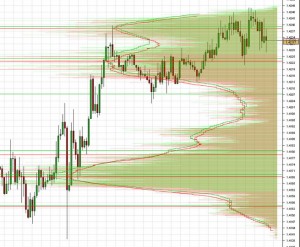 In addition, an moving average with the selected period from a volume value is drawn on the histogram separately for the BID and ASK prices. In calculated local maxima, horizontal lines are drawn to clearly indicate price range with the greatest local volume. The minimum distance between the drawn maxima can be set by the user.
The drawn volume is examined from each tick, which is why the indicator is very accurate and reliably reflects reality.
FxCraft Volume Levels indicator not only draws the histogram based on historical data starting with the set date, but also updates bar sizes in real time, deriving data from upcoming ticks.
When launching the indicator, set the start date (“Start time” parameter) to specify the time from which the indicator should download the data in order to draw the histogram. The histogram will be updated with upcoming ticks in real time.
If you set the start date later than the current time, the indicator will draw the histogram only based on the data that will come in real time.
The indicator acts as a strategy since Dukascopy does not provide the indicators with the data required here. Thus, the indicator is launched in the window with the selected instrument. If several windows with the same instrument are opened, the strategy is launched only in one window (always the same one). Unfortunately, choice of the window is not available (restrictions on the Dukascopy platform).
If you want to draw the histogram based on a large amount of data, downloading the data after launching the indicator may take a while depending on the internet connection.


 The indicator allows you to read relevant information which is not provided by the existing tools. The indicator perfectly reflects prices used for concluding significant transactions for large sums, which is why you can immediately see how big money behaves. It thus determines support and resistance levels in a natural way. This is crucial information allowing you to make wise decisions when trading.